
QQQ weekly: 1 - 5 Jun 2026
Pullback

Price action
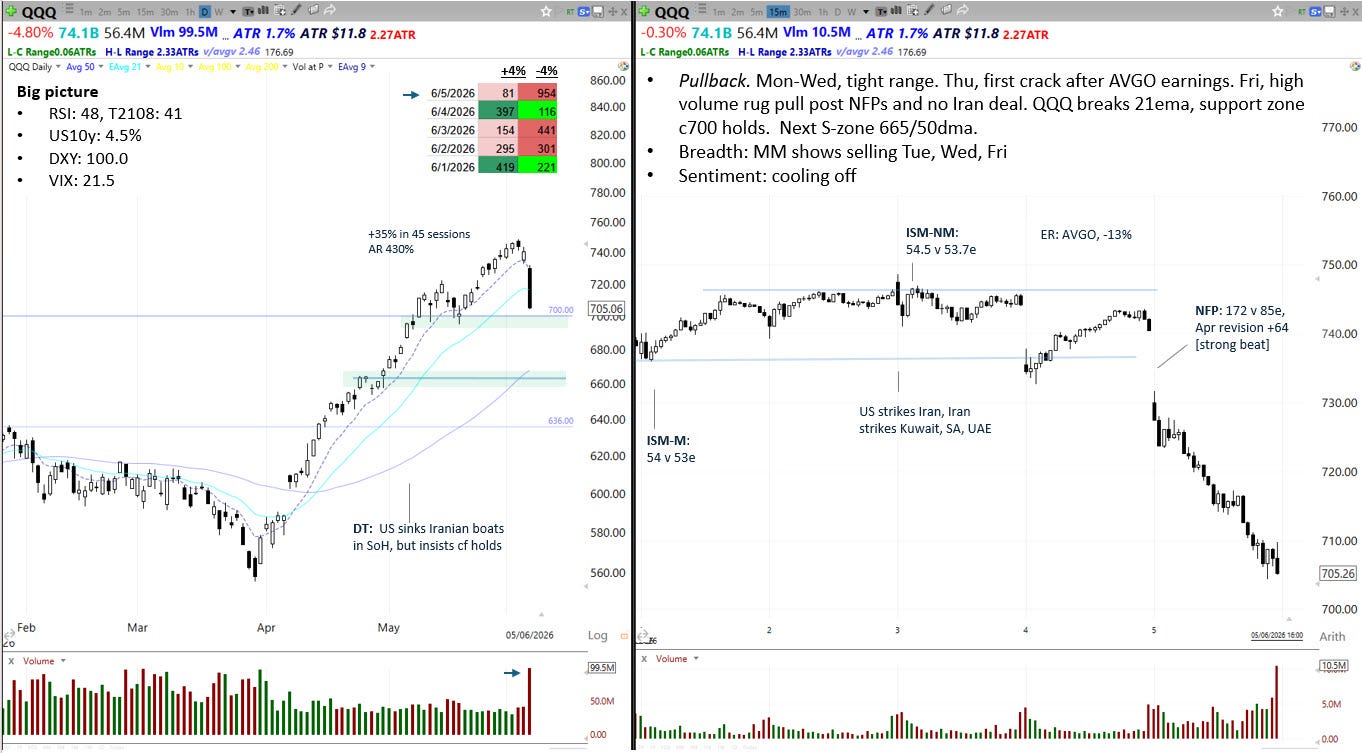
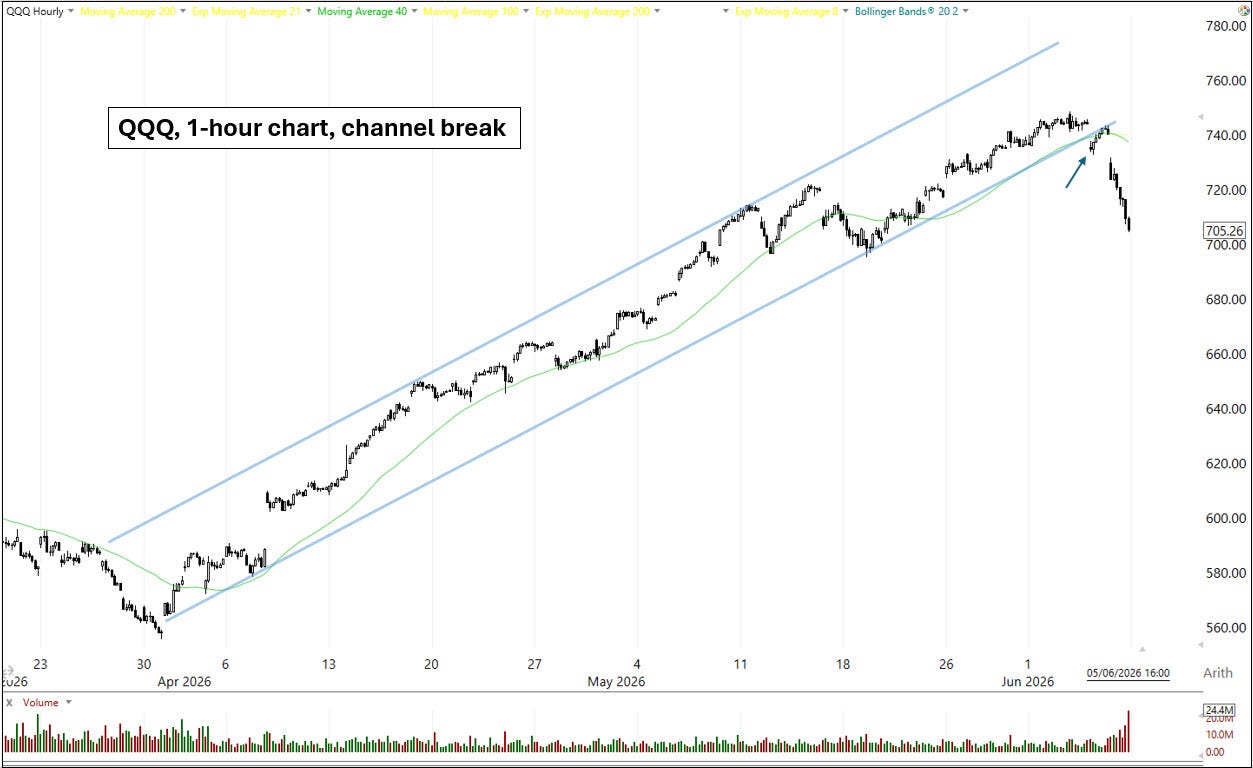
QQQ held in a steady range from Monday to Wednesday. On Thursday, a crack appeared, with QQQ gapping down -1.2% after AVGO’s disappointing earnings report, which included weaker than expected revenue guidance. Although buyers stepped in to push QQQ back up near highs, Thursday’s price action broke the narrow bullish channel on the 1-hour chart (see below). I noted last week that a break of this channel could work as an early sign of a change of character, which turned out to be the case (see below).
The most proximate catalyst for Friday’s sell off was the release of NFPs before the bell. The data were very strong: May came in at 172k v 85k expected, and April was revised up by 64k. In the context of rising inflation, this served to lift the market-implied probability of a Fed rate hike later this year (more on that in the Fed section below). The other headwind of note was the continuation of military strikes by America against Iran, and Iran against its Gulf neighbours, including a drone attack on Kuwait airport on Wednesday. The upshot was a day of heavy selling on Friday, which saw QQQ drop -4.8%, or 3.5 ATRs. A very big move, which came on very high volume.
Where to now? The good news is that QQQ is no longer overbought: its RSI is back to 48, and it’s gone from 8.6 ATRs above its 50dma to 3.2. The other good news is that support at 700 held. However, momentum is now clearly to the downside, and the character of the tape has changed. We could well be seeing the start of a protracted period of choppy and corrective price action, which would fit the seasonal pattern for midterm summers.
The Fed
This week’s FOMC speakers reflected the Fed’s continuing hawkish drift since the conflict in the Middle East began. On Friday, after the NFP release, Beth Hammack commented, “if recent trends continue, it could soon be appropriate for the Fed to act against high inflation”.
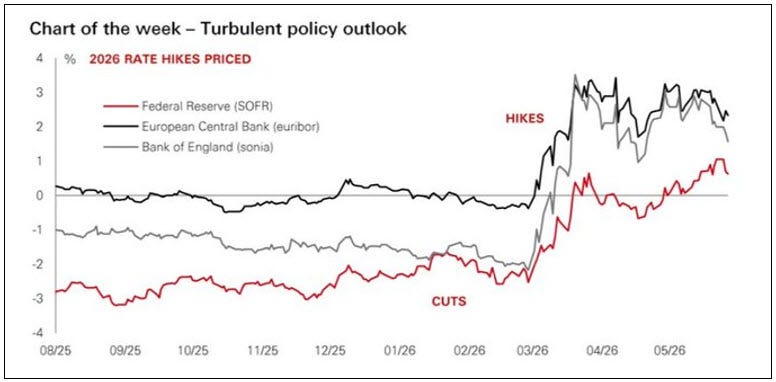
Disinflationary progress is fading in the rear view mirror. The US jobs market is now showing remarkable strength, the situation in Iran remains unresolved, price pressures from tariff are still at large, and the AI capex boom appears to be leaking into CPI. Accordingly, the Fed is turning hawkish and the market is now pricing in hikes later this year (as shown in the chart below). This is not constructive for QQQ.
May’s CPI print will be released before the bell on Wednesday. A hot print in the absence of a deal with Iran could cause problems for QQQ. A further source of uncertainty is the Fed’s next meeting, which is on 17 June. We don’t know what Warsh thinks about the recent moves in jobs and inflation, we don’t know how he’ll bring the FOMC together, and we don’t know how well he’ll communicate with the market at the press conference.
Markets & Narratives
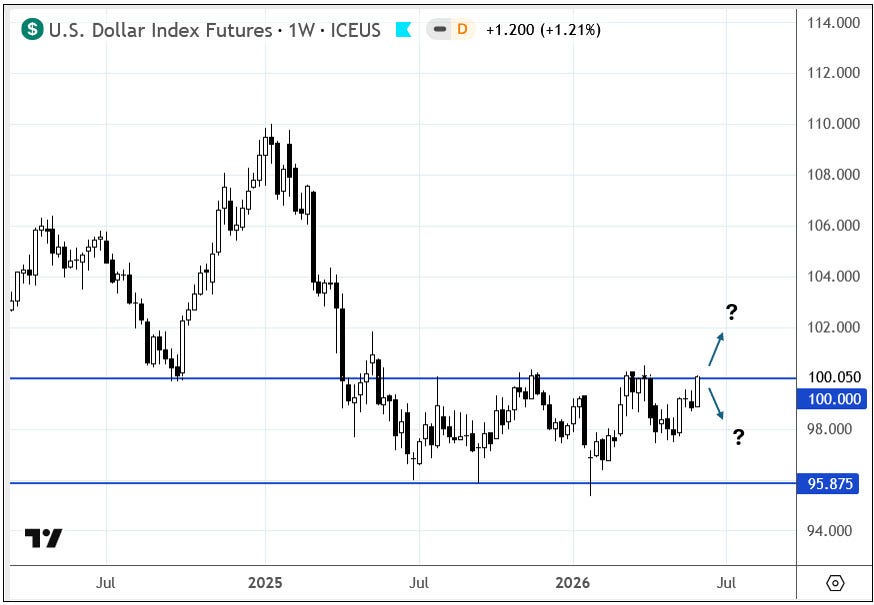
One consequence of a more hawkish Fed is a stronger US dollar. If DXY breaks 100 and moves higher, this is unhelpful for mega cap tech, which earns a lot of revenue outside the US. This is a chart to watch in June.
Breadth
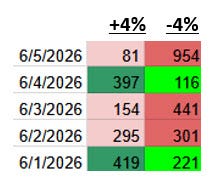
Stockbee’s Market Monitor appears in the daily panel of the first chart at the top of these posts. It shows how many stocks finished each day of the week either +4% or -4%. This tool helps to identify breadth thrusts, either bullish or bearish. This week it showed evidence of a bearish breadth thrust. Friday was particularly bad, with almost 1,000 stocks down -4% on the day.
This was reflected in the McClellan Summation Index, which is rolling over - another unhelpful sign for QQQ. However, there were some bright spots of bullish rotation. Although QQQ fell -4.5% on the week, some notable sectors were up: XLV (healthcare) +2.4%, XLF (financials) +1.4%, IAK (insurance) +4.0%, IYR (real estate) +1.0%.
Sentiment & Positioning
Last week we noted how the NAAIM survey at 98, and the put call ratio 5dma sub 0.6 were evidence of euphoria, which suggested caution. While these weren’t backed up by a host of other sentiment and positioning metrics, Friday’s price action show that investors had indeed pushed too far in tech broadly, and specifically in the AI hardware story. As price ratchets ever higher, traders tighten their stops, so once price starts to roll, it can lead to a cascade of selling. This chart from Morgan Stanley, via the MarketEar, shows how hedge fund exposure to semis and hardware has increased this year to a remarkable 35% of net exposure.

If QQQ and SMH (the semiconductor ETF) now enter a corrective phase, we should expect sentiment and positioning indicators to reset to neutral levels (or to bearish levels if a real pullback develops). This will help set up the conditions for the next bullish phase in due course.
Seasonality
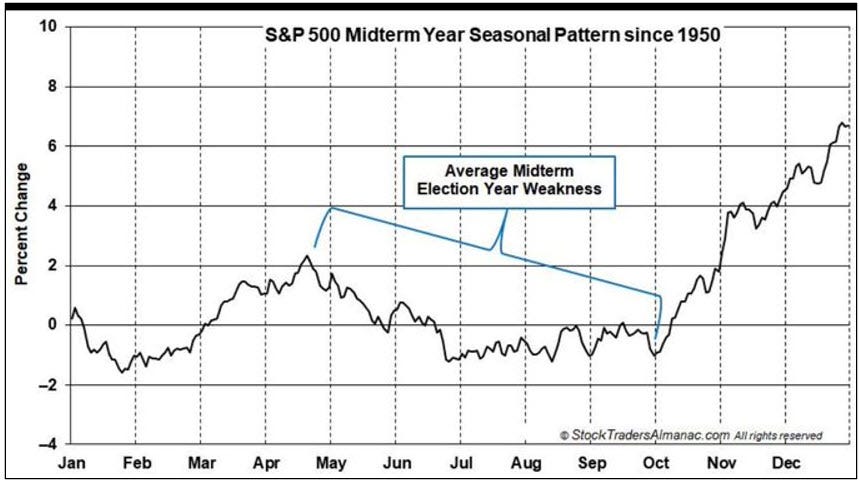
Poor midterm seasonality may now be upon us. The S&P500 seasonality chart below comes from Stock Traders Almanac, via X. It shows how the middle of midterm years can be choppy and frustrating.
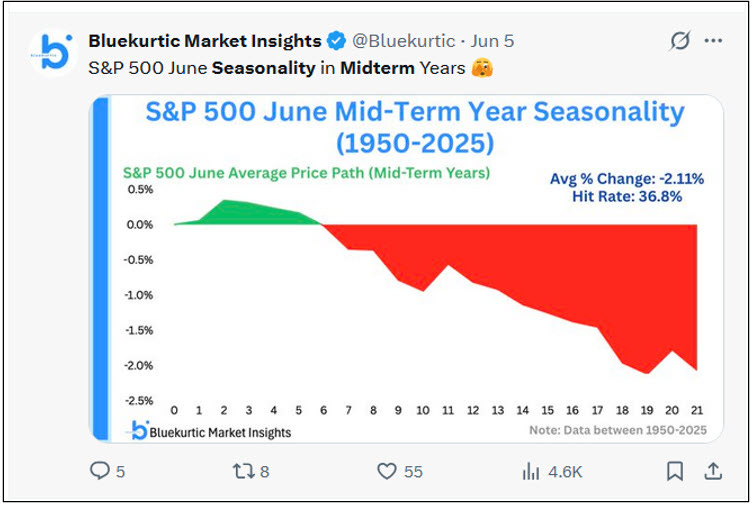
For more granularity on Junes of midterm years, the post below from Bluekurtic is helpful. It shows the second half of the month can be very challenging.
Summary
Price action: Having become overbought, on Friday QQQ dropped -4.8% on high volume, breaking the steep bullish trend on the 1-hour chart in play since the late March low. QQQ appears to be beginning a corrective phase. The long-term primary trend remains bullish.
The Fed: FOMC speakers continue to be hawkish. NFPs were strong. Markets are pricing in Fed rate hikes later this year.
Markets & Narratives: 1/ USD is close to breaking out to the upside above 100. 2/ Iran - no deal yet. 3/ AI-adjacent stocks sold off hard after AVGO’s disappointing guidance in its earnings report.
Breadth: weakening
Sentiment & Positioning: cooling after select indicators reached euphoric levels.
Seasonality: the US Presidential Cycle suggests choppy conditions from now till midterm elections.
Key events next week: Iran news, Wednesday - CPI
View
Short-term: corrective phase likely beginning
Last week we suggested June might see trading conditions deteriorate because 1) QQQ was very overbought, 2) there were emerging signs of euphoric sentiment in NAAIM and options markets, and 3) seasonality was becoming difficult. It looks like this is playing out. My base case now is for a stretch of consolidation, either in the form of a pullback or a choppy range. This coming week, a hot CPI print might produce another leg lower; a US/Iran deal might produce a bullish rotation into laggard sectors.
In a corrective phase, swing trading becomes much harder because breakouts have a higher tendency to fail. I have closed my swing positions and will now wait patiently for conditions to improve again. In the meantime, there could be decent intraday/short-term news trades relating to Iran (deal or deterioration), or perhaps around the release of CPI this coming Wednesday.
Long-term: cautious bullish
From a long-term technical perspective, QQQ is trending in a bullish primary channel in play since late 2022. It sits above its long-term moving averages, which are sloping upward. The bull market is intact.
From a fundamental perspective, there are tailwinds supporting a long-term bull market. Fiscal support continues, with the US running a large deficit that stimulates the economy, which is strong; corporate earnings have been stellar; and the AI theme suggests trillions of annual capex spending ahead.
While I’m bullish from a long-term perspective, there are still reasons to be cautious about where we could be 6-12 months hence. The Iran conflict is still unresolved, there is uncertainty around inflation and Warsh’s Fed, and midterm seasonality is unhelpful until Q4.
If you find my posts useful, please do share with friends and colleagues.
See you next week,
Alex