

QQQ weekly: 6-10 May

Price action
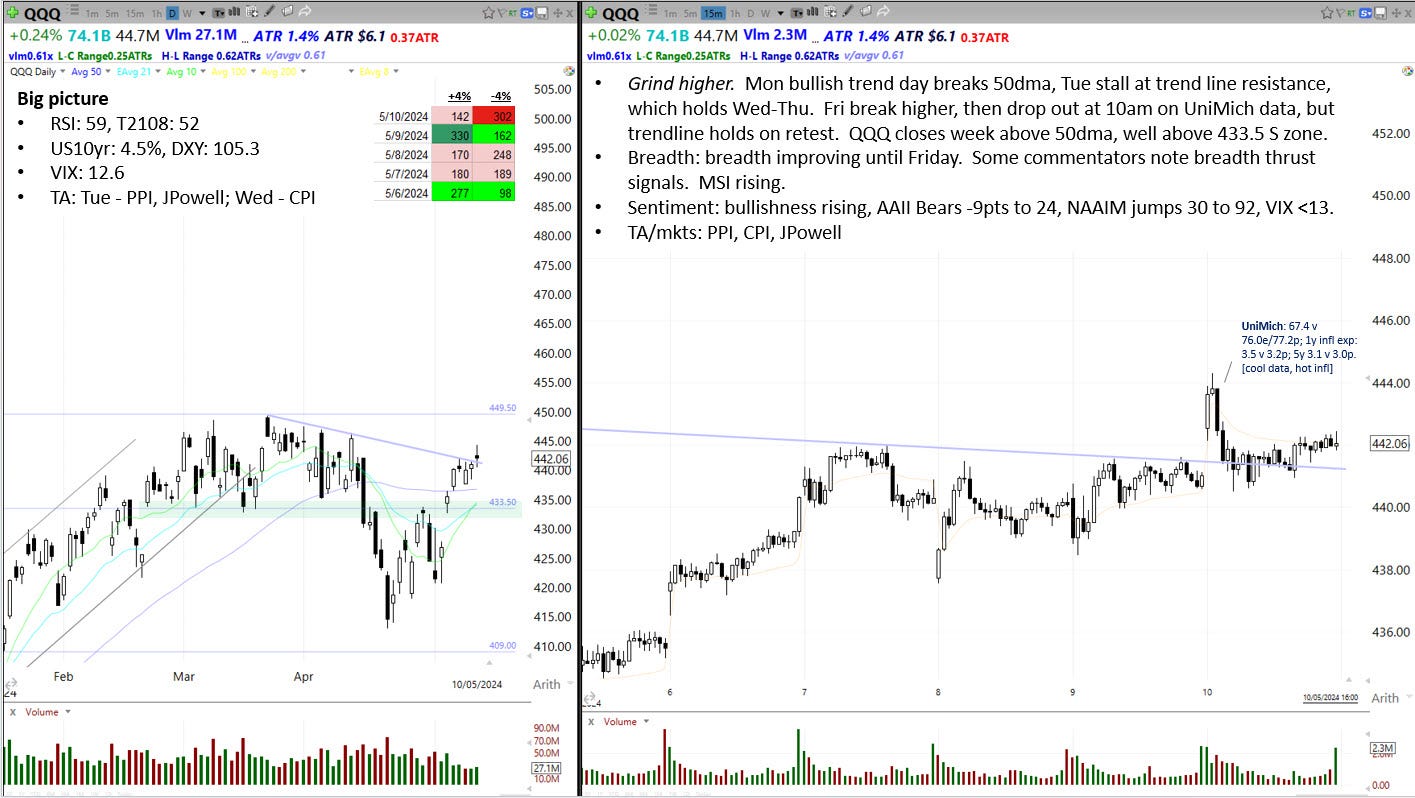
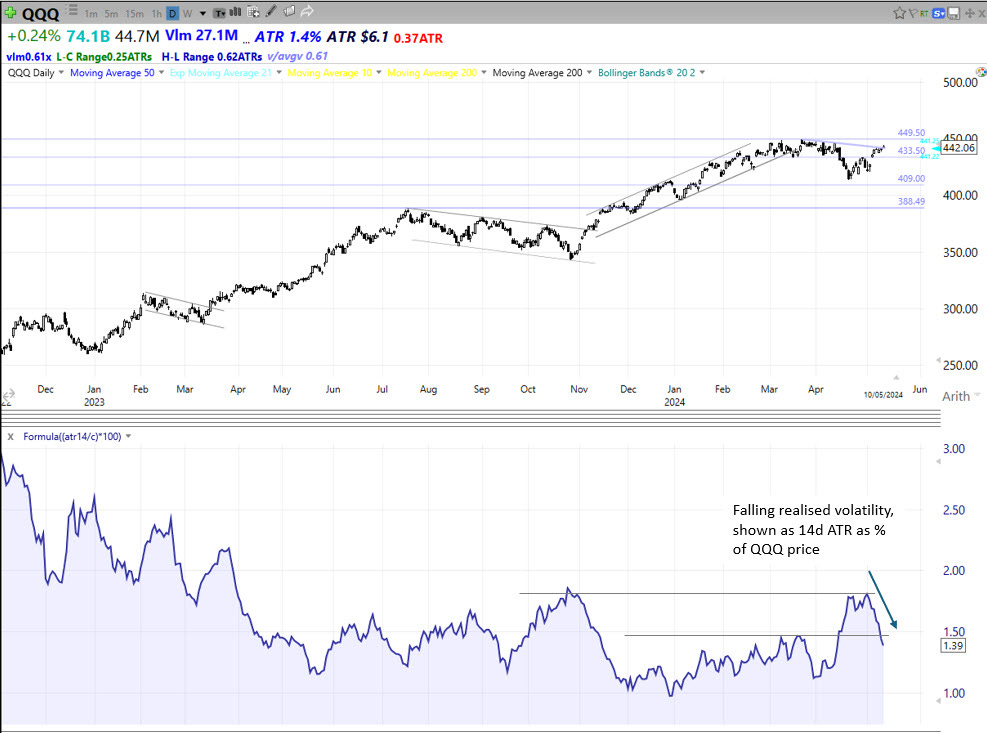
QQQ continued to recover from its mid-April flush, albeit at a slowing pace. Last week we noted that the trendline down from March-April highs might act as resistance, and it did. Bears need to see a lower high or double top appear soon; bulls need to see a continued grind through this area to new all time highs.
Realised volatility is returning to levels consistent with a bullish phase. QQQ 14dATR % is now sub 1.5% and falling.
The Fed
Fed speakers were back on deck after last week’s FOMC meeting. Many expressed uncertainty about the restrictiveness of current policy and uncertainty about what inflation and the economy might do next:
Collins (Wed): hard to say how restrictive policy is
Daly (Thu): considerable uncertainty about next few months of inflation
Bostic (Fri): timing of cuts uncertain
Logan (Fri): uncertainty whether policy is sufficiently restrictive
Goolsbee (Fri): Fed is trying to determing if recent inflation is a bump in the road or are we getting stuck in inflation?
Kashkari (Fri): cautious about how restrictive monetary policy is
This uncertainty comes from the fact that activity data and inflation data are sending opposing messages. On the activity front, Thursday’s intial jobless claims came in higher than expected and on Friday the University of Michigan consumer sentiment survey showed a sizeable fall. These signs of slowing activity follow a run of cool data last week. That ought to be good news for the Fed who believe a cooling economy will help them acheive their 2% inflation target.
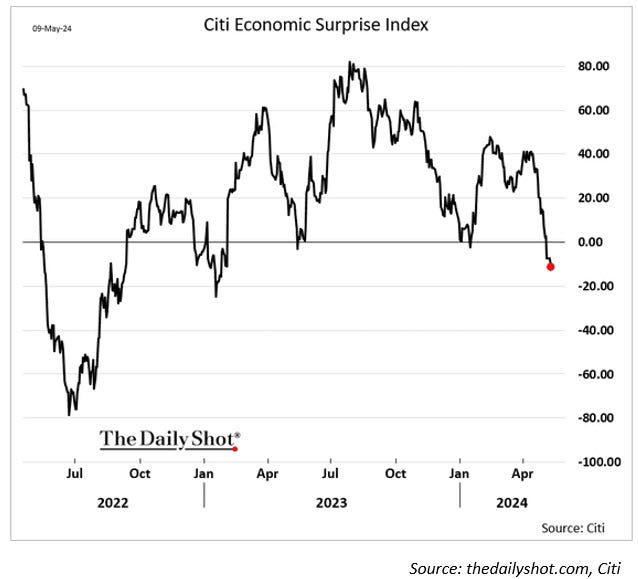
However, recent inflation data is telling a different story. Last week the prices paid components of both ISM-M and ISM-NM increased. This week the 1yr and 5 yr inflation expectations components of the University of Michigan’s survey both edged up (1yr up from 3.2% to 3.5%, 5yr up from 3.0% to 3.1%). Next week we have the big inflation numbers: PPI on Tue 14 May, and CPI on Wed 15 May. The Fed will be hoping those prints follow recent activity data lower.
What did we learn about markets?
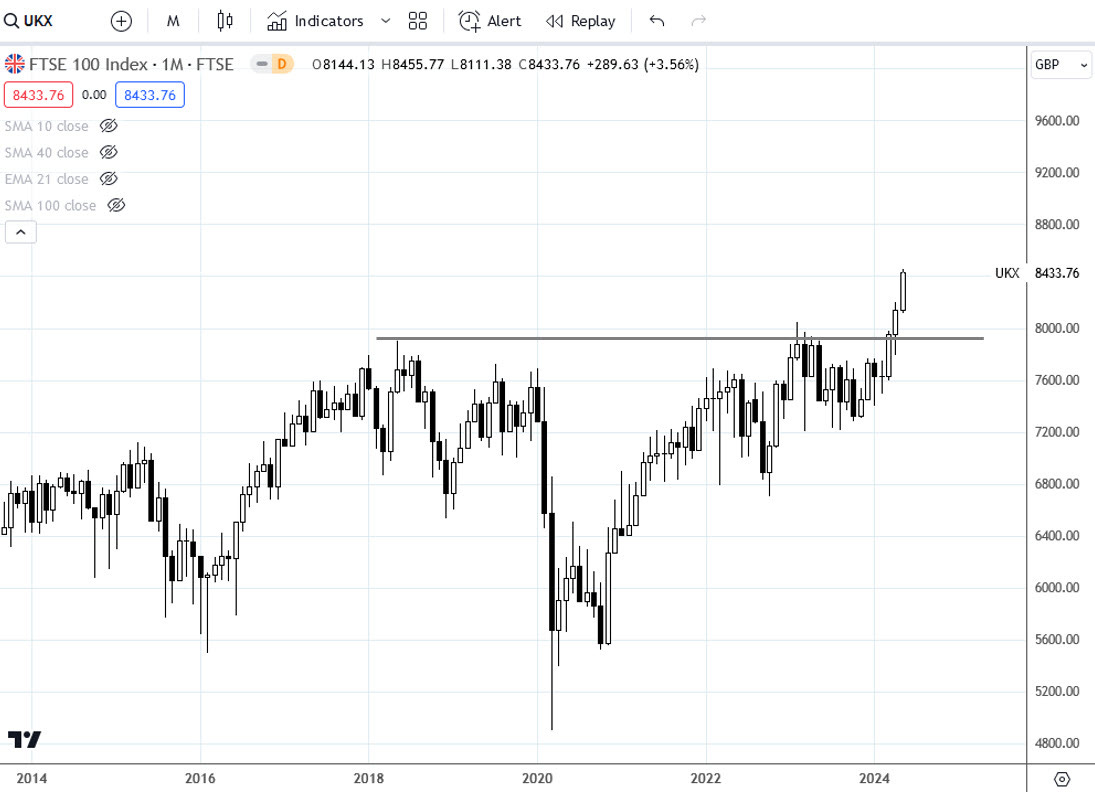
While QQQ has been chopping around since mid-January many global indices have been showing continued strength, which is constructive. Recently, the UK joined the party with the FTSE 100 breaking through major long term resistance.
The FTSE 250 is threatening to break resistance as well.
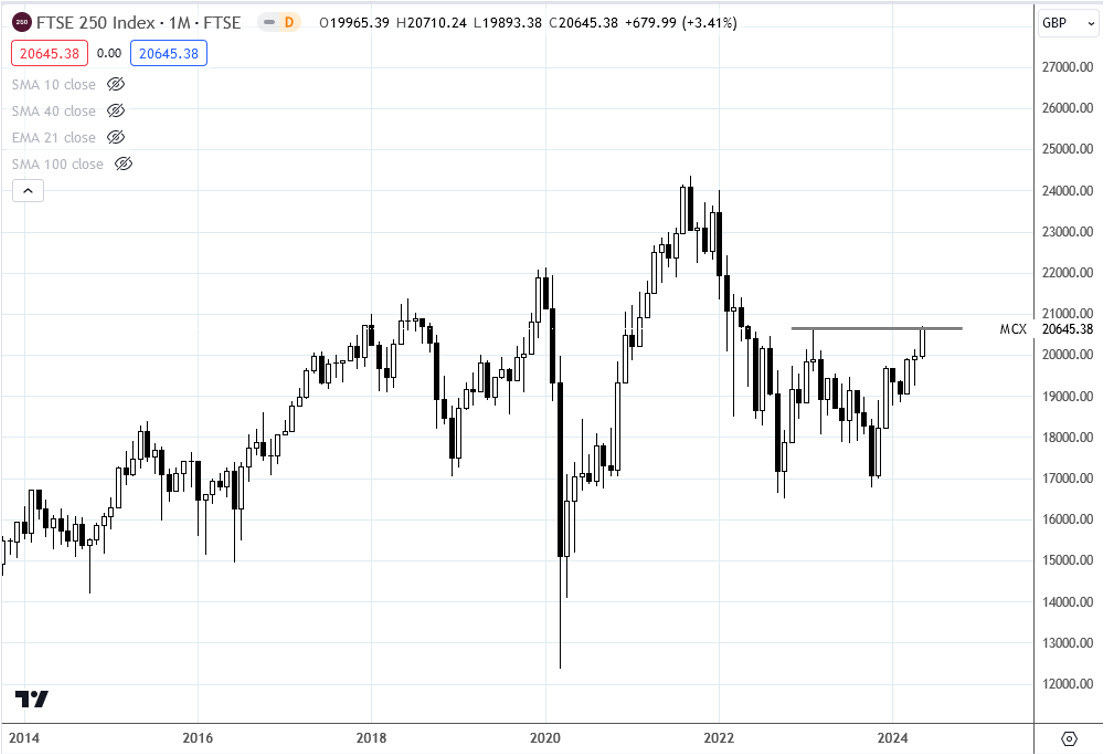
Technical analysis works best in conjunction with fundamental analysis. There are a number of fundamental factors supporting UK stocks.
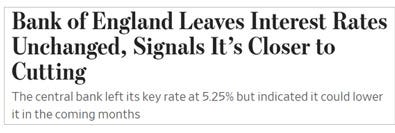
BoE signals cuts:

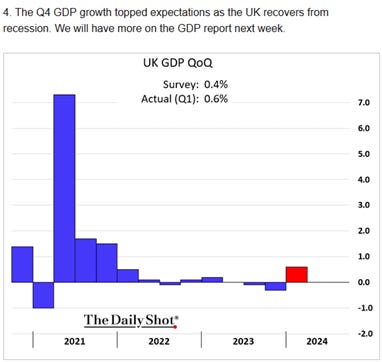
Domestic GDP recovery:
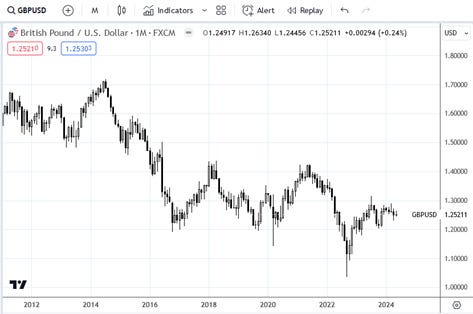
A persistently weak currency helps the FTSE 100 as its constituents derive around 75% of their earnings from overseas:
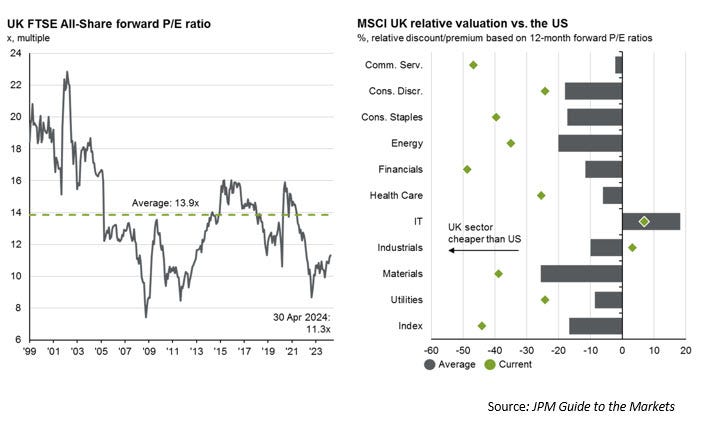
UK stocks are cheap:
Breadth
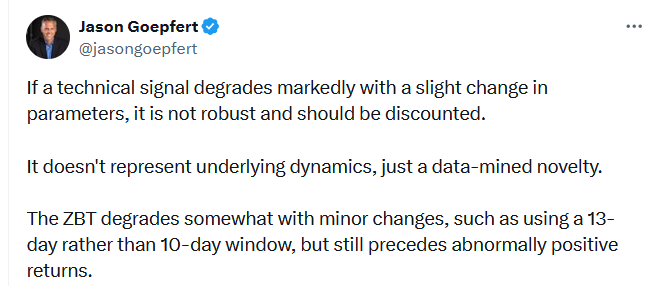
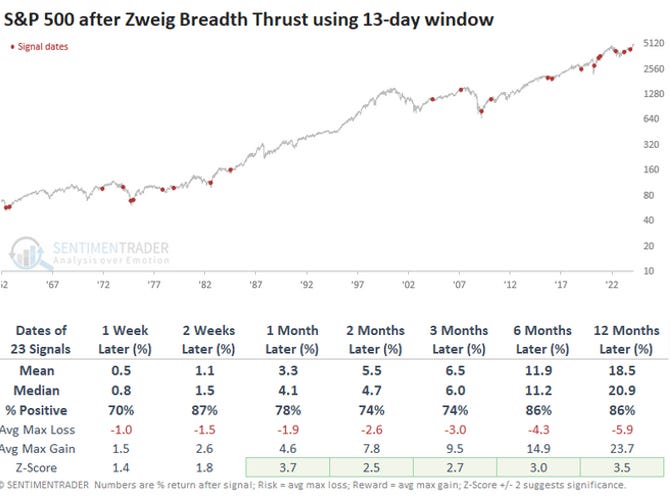
Breadth was poor on Friday. However, earlier in the week some commentators spotted a bullish breadth signal. A Zweig Breadth Thrust occurs when breadth goes from oversold to overbought in 10 trading sessions. It is a long term bullish indicator with a very good track record. This week we didn’t get a ZBT, but we came close - breadth improved the stipulated amount, but over 13 days, not 10. This has a decent track record too, as explained in this post by the excellent Jason Goepfert:
https://x.com/jasongoepfert/status/1787808231584104634
Sentiment
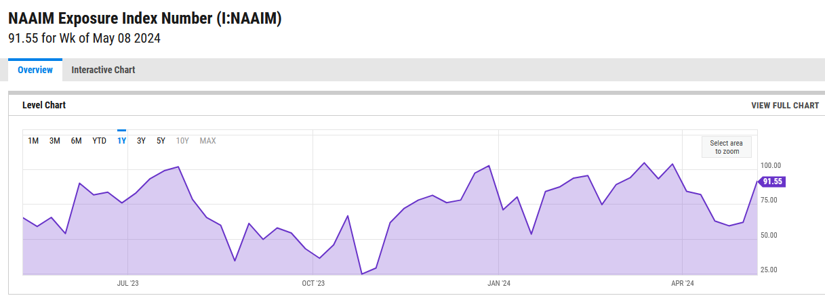
Sentiment has improved markedly. This week AAII Bears declined -9pts, while the NAAIM jumped +30 points to 92.
Summary
QQQ continues to recover from its mid-April flush. Realised volatility is declining. The longer term primary trend remains bullish.
Fed speakers emphasised uncertainty this week. Activity data has been slowing, but inflation data has not. Higher for longer remains the base case.
Breadth was poor on Friday, but over the last two weeks it has improved fast enough and far enough for some to conclude a significant breadth thrust has occurred.
Sentiment is returning to bullish levels.
Key events next week: Tue - PPI and JPowell, Wed - CPI.
PS, an explainer for the weekly slide can be found here: