Price action
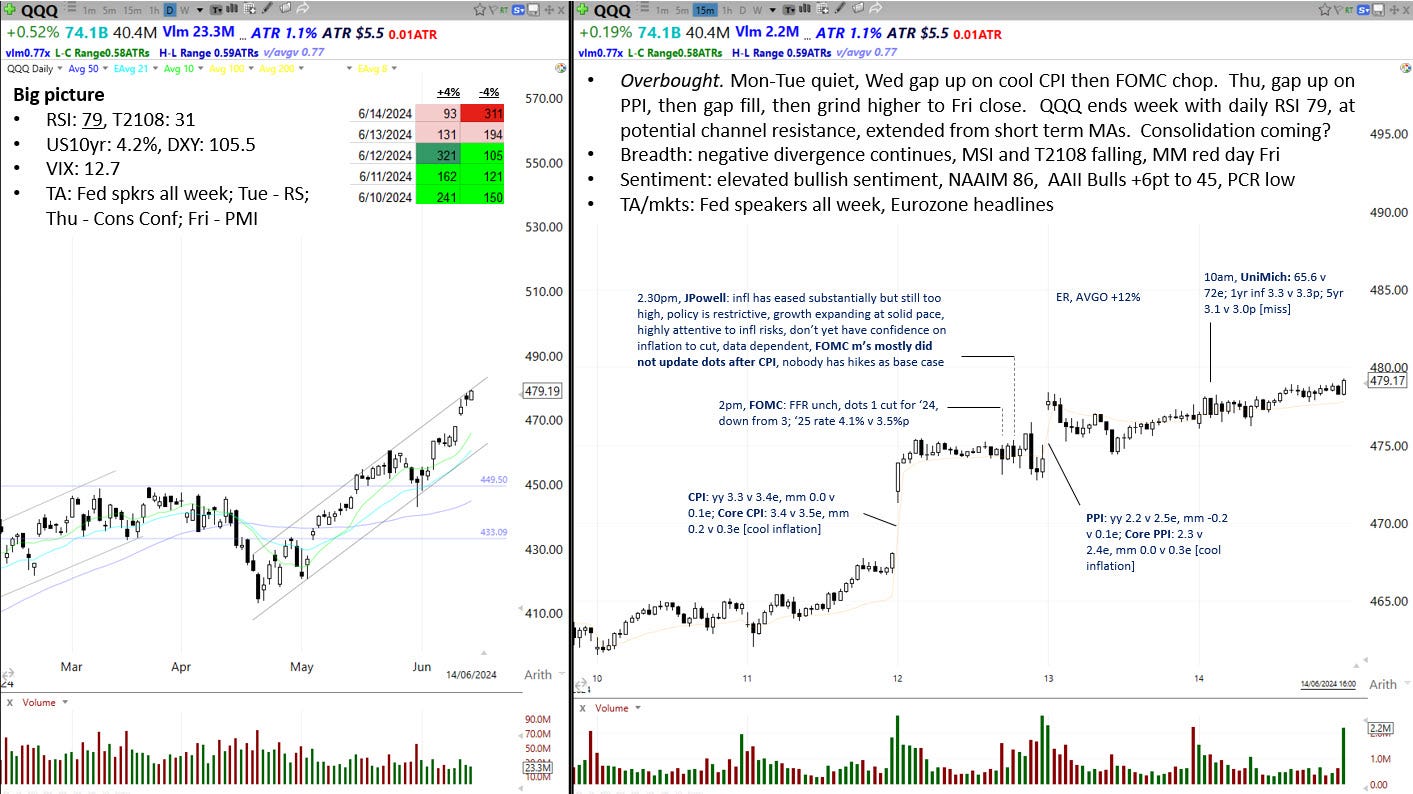
QQQ pushed higher again, propelled by cooler than expected inflation data on Wednesday (CPI) and Thursday (PPI). QQQ is now in overbought territory. The daily RSI is at 79. Low 80s is possible, but unusual. QQQ is +2.4 ATRs above its 10dma, which is approaching the highest levels of this bull market. Plus, QQQ may be nudging the upper band of an emerging bullish channel.
While the longer term primary trend remains bullish, it’s not unreasonable to expect some consolidation in the short term.
The Fed
On Wednesday at 2pm the Fed released its policy statement and an updated set of dot plots. The dots for the Fed Funds Rate were hawkish. They implied only one interest rate cut between now and the end of 2024, down from three in the previously issued dots. However, this didn’t move the market for two reasons. First, Fed speakers have been telling us for weeks that they don’t yet have the confidence to initiate a cutting cycle, so it was no surprise to see the new dots reflect that higher-for-longer message. Second, JPowell explained in the presser that most of the FOMC voters didn’t update their dots after the release of cooler than expected CPI that morning. He was keen to repeat that point twice, the inference being that the dots could have been less hawkish had they been updated.
At the end of the week two Fed speakers were willing to project an optimism that has been conspicuously absent for months:
Goolsbee (Fri): CPI very good, relief, if we get more data like that then the Fed can cut.
Mester (Fri): need to see a few more months of ebbing inflation data, important not to wait too long to cut.
What did we learn about markets?
The snap election in France has emerged as a potential source of market volatility. This week France’s finance minister warned of a potential financial crisis if the far right Rassemblement National party wins. This has the makings of a summer squall with the potential to spread from French markets to global ones.
French CDS spreads are moving quickly.
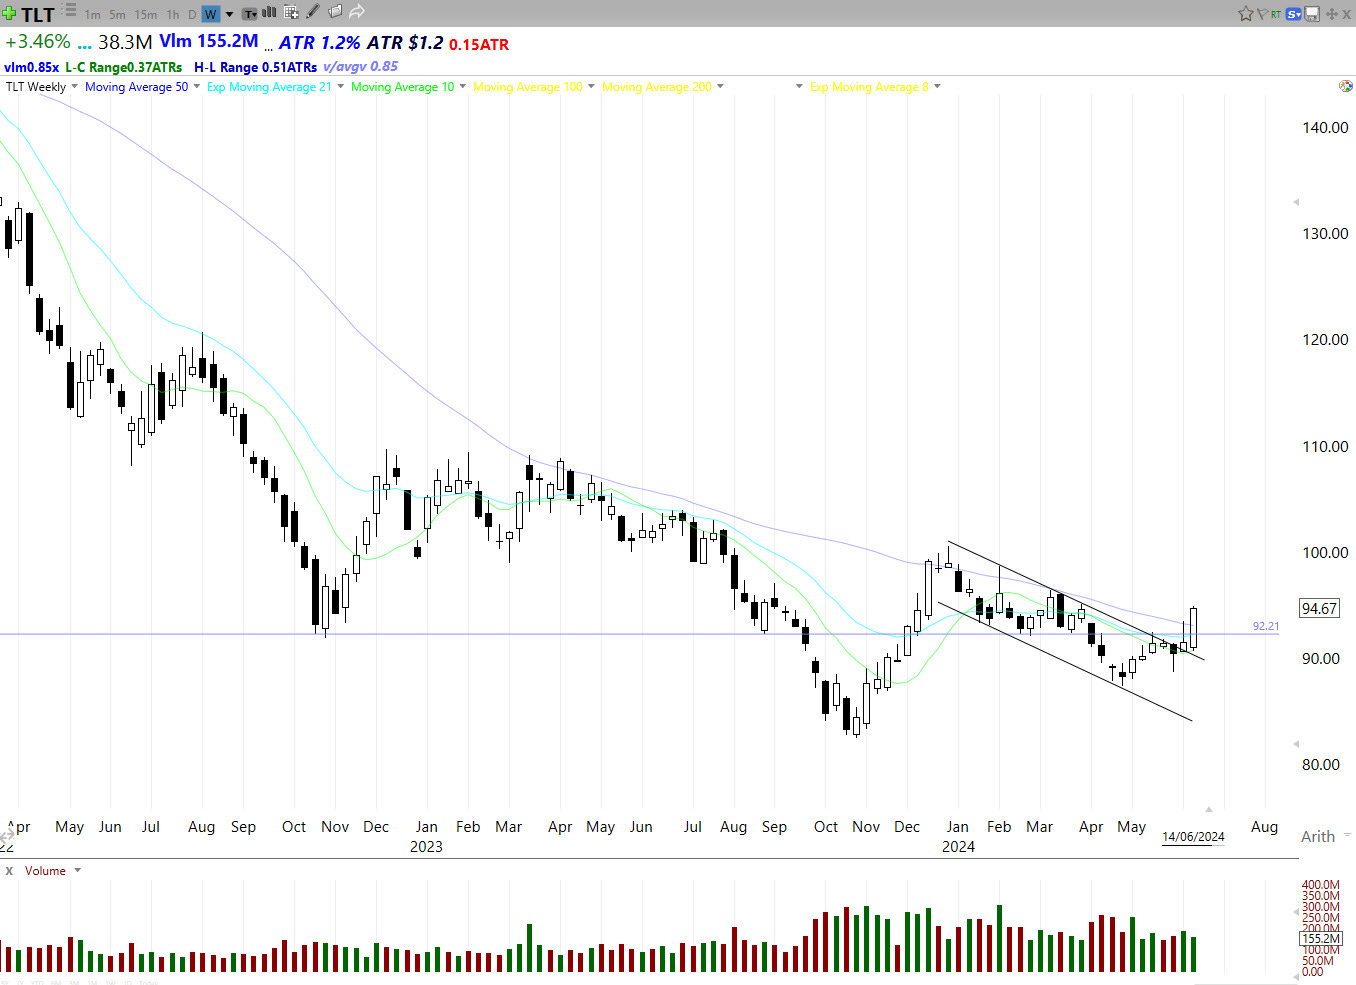
We may have seen some flight-to-safety price action in USTs. Falling bond yields due to cooling inflation is constructive for QQQ, but falling bond yields due to risk-off psychology is not. The chart below shows TLT, the US treasury bond ETF. It seems to have broken out of its bearish trend channel and is now holding above key levels. Next stop 100?
Breadth
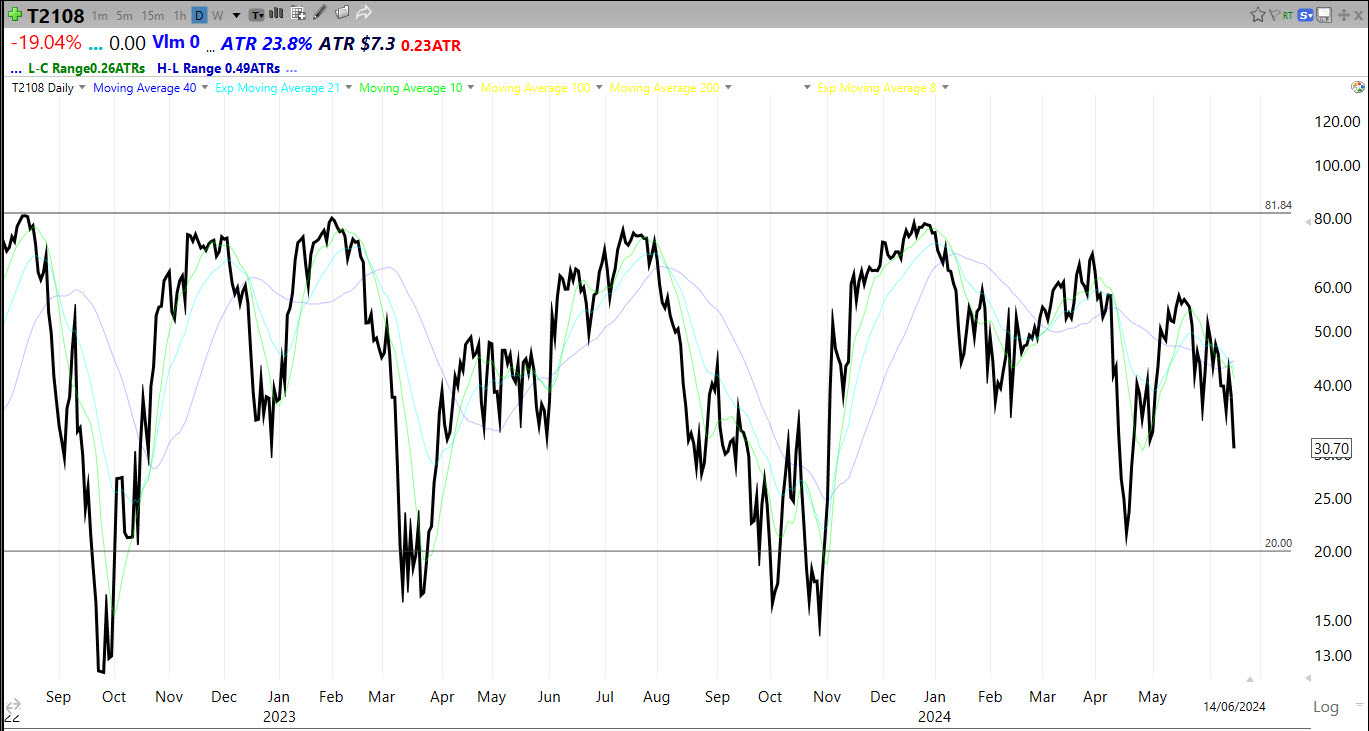
The negative breadth divergence is getting worse. Breadth is not confirming the bullish price action in QQQ. This could be problematic.
McClellan Summation Index: still falling
% stocks above 40dam: falling
Sentiment
Sentiment ticked back up towards elevated bullish levels.
NAAIM: back up to 86
AAII: Bulls rise +6pts to 45%, Bears down -6pts to 26%
The put call ratio 5dma has fallen back down to lows
Summary
QQQ continued to rise, propelled by constructive inflation data. While the long term primary trend remains bullish, QQQ is overbought in the short term and may be hitting resistance at the top of its current channel.
The Fed released dot plots that were hawkish, however, this was mitigated by cool CPI on Wednesday and cool PPI on Thursday. At the end of the week, Fed speakers expressed optimism about inflation.
A new and potentially disruptive geopolitical narrative has emerged from France.
Breadth is not supporting new highs in the indices, which is problematic.
Sentiment is rising again. The put call ratio is low, which is a contrarian bearish indicator.
Key events next week: Fed speakers all week; Tue - Retail Sales; Thu - Consumer Confidence; Fri - PMIs.
PS, an explainer for the weekly slide can be found here:


